Case Study
KulinaStock Forecast System
A stock forecasting platform designed to analyze historical inventory usage using forecasting methods such as SES, Holt, and Holt-Winters with accuracy metric evaluation.
System Focus
Forecast Analytics
The platform focuses on forecasting future stock requirements based on historical inventory consumption data.
Forecast Engine
Time Series Models
Multiple forecasting methods are implemented to compare prediction quality and improve decision-making accuracy.
Accuracy Metrics
MAE • MAPE • RMSE
Forecast quality is evaluated using standard statistical error metrics for performance comparison.
Architecture
System Architecture Overview
The system architecture separates frontend dashboard operations, forecasting services, API handling, and persistence layers to improve scalability and maintainability.
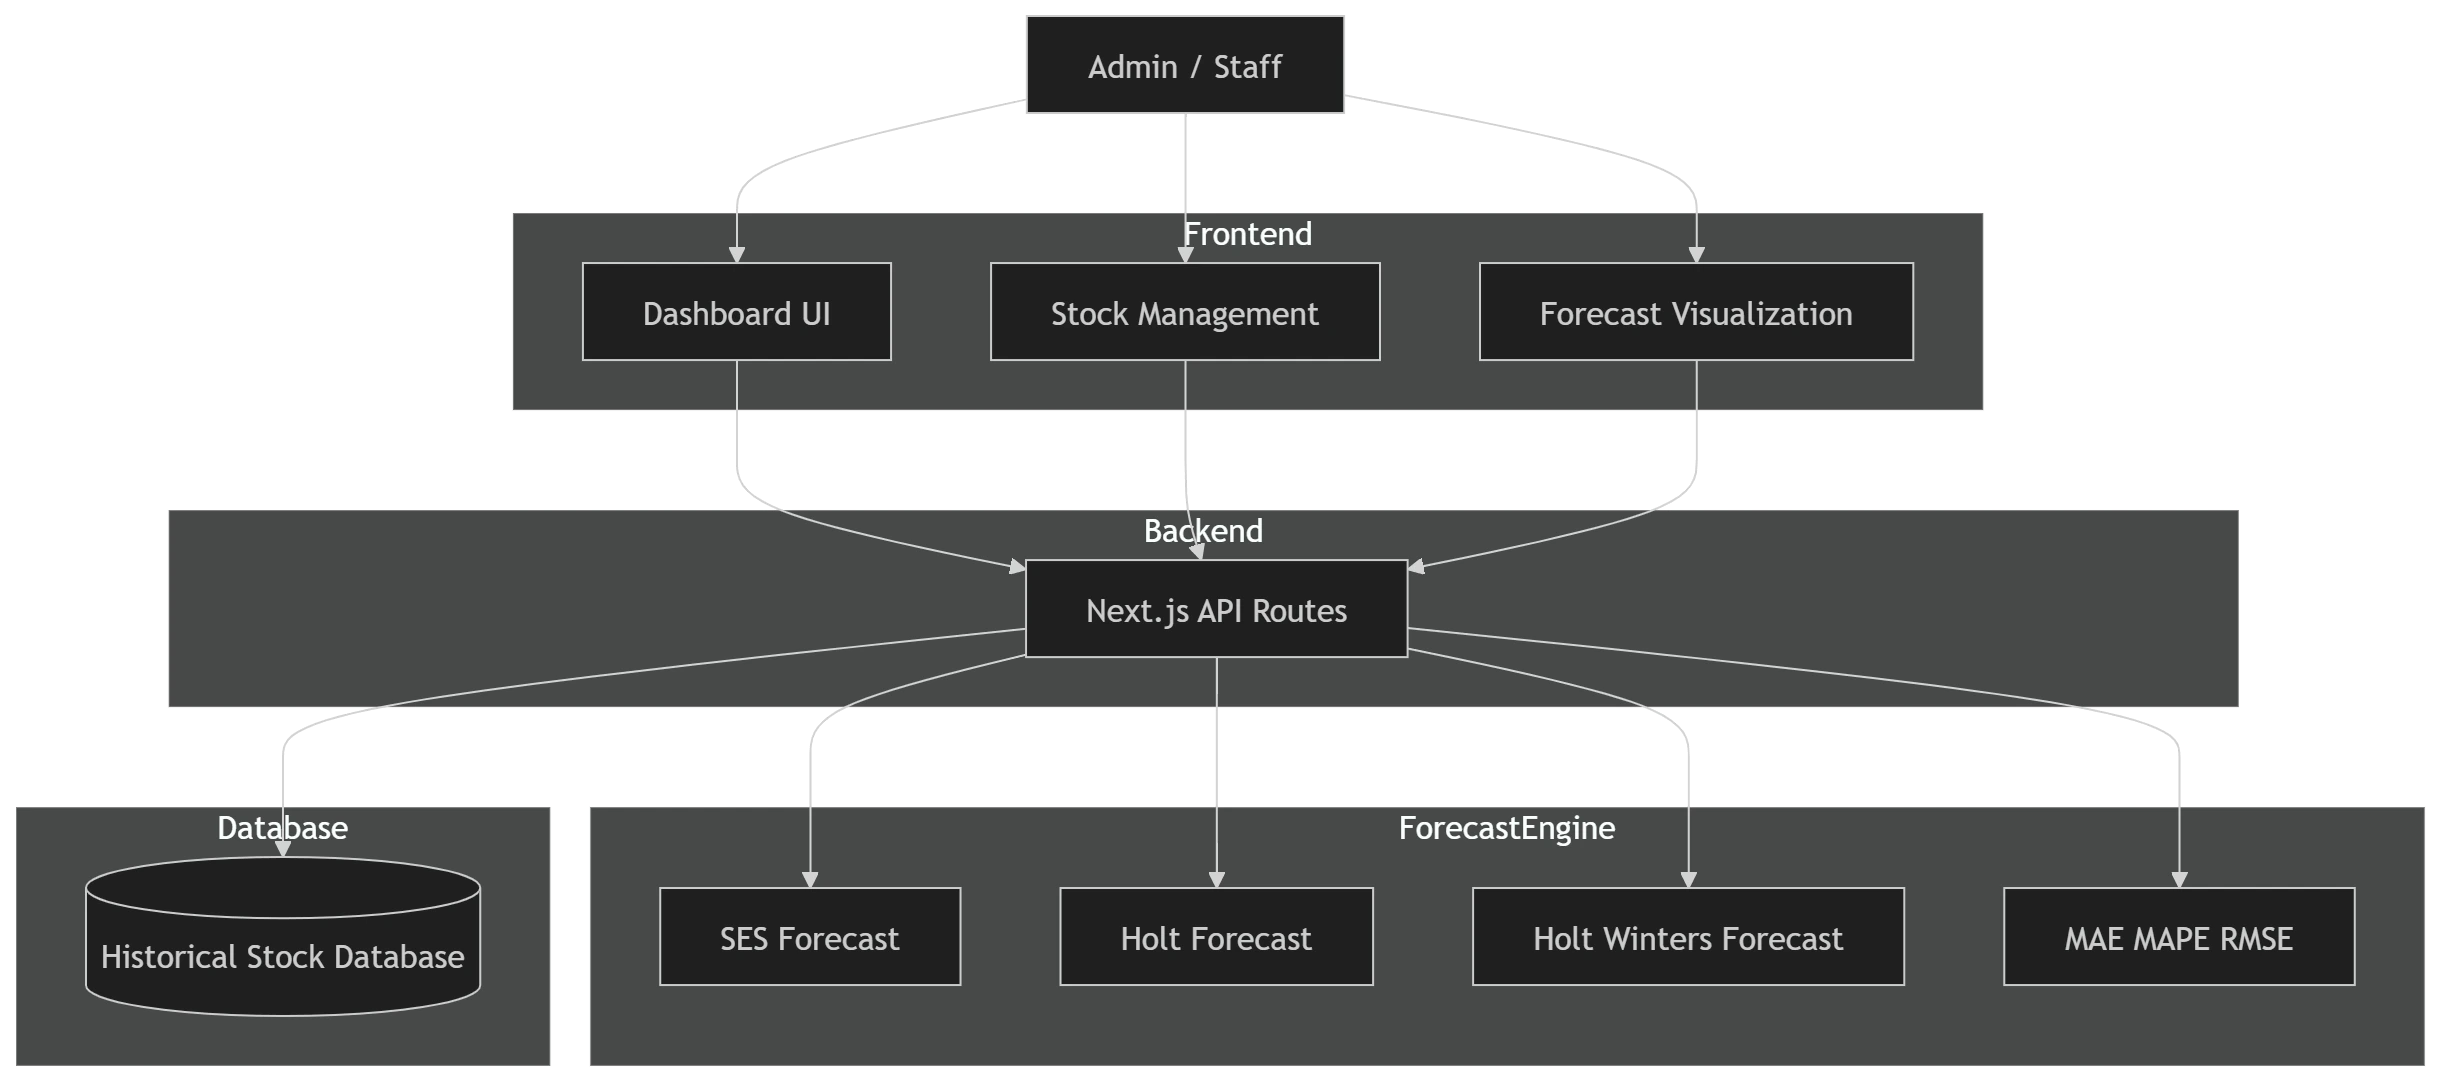
Forecast Engine Separation
Forecasting logic is isolated into dedicated processing modules to simplify method comparison and future extensibility.
Modular Backend API
API routes handle forecasting requests, historical data retrieval, and metric calculations independently from the UI layer.
Engineering Decisions
Forecasting Strategy
The forecasting system was designed to support comparative analysis between multiple time-series forecasting algorithms.
Why SES?
Simple Exponential Smoothing is effective for stable datasets without strong trends or seasonal patterns.
Why Holt Method?
Holt forecasting improves prediction quality for datasets containing linear trends over time.
Why Holt-Winters?
Holt-Winters supports trend and seasonality detection for more complex forecasting scenarios.
Why Multiple Metrics?
MAE, MAPE, and RMSE provide different perspectives on forecasting accuracy and prediction error quality.
System Analysis
Use Case Diagram
The use case diagram models interactions between administrators, staff members, and forecasting modules during inventory analysis workflows.
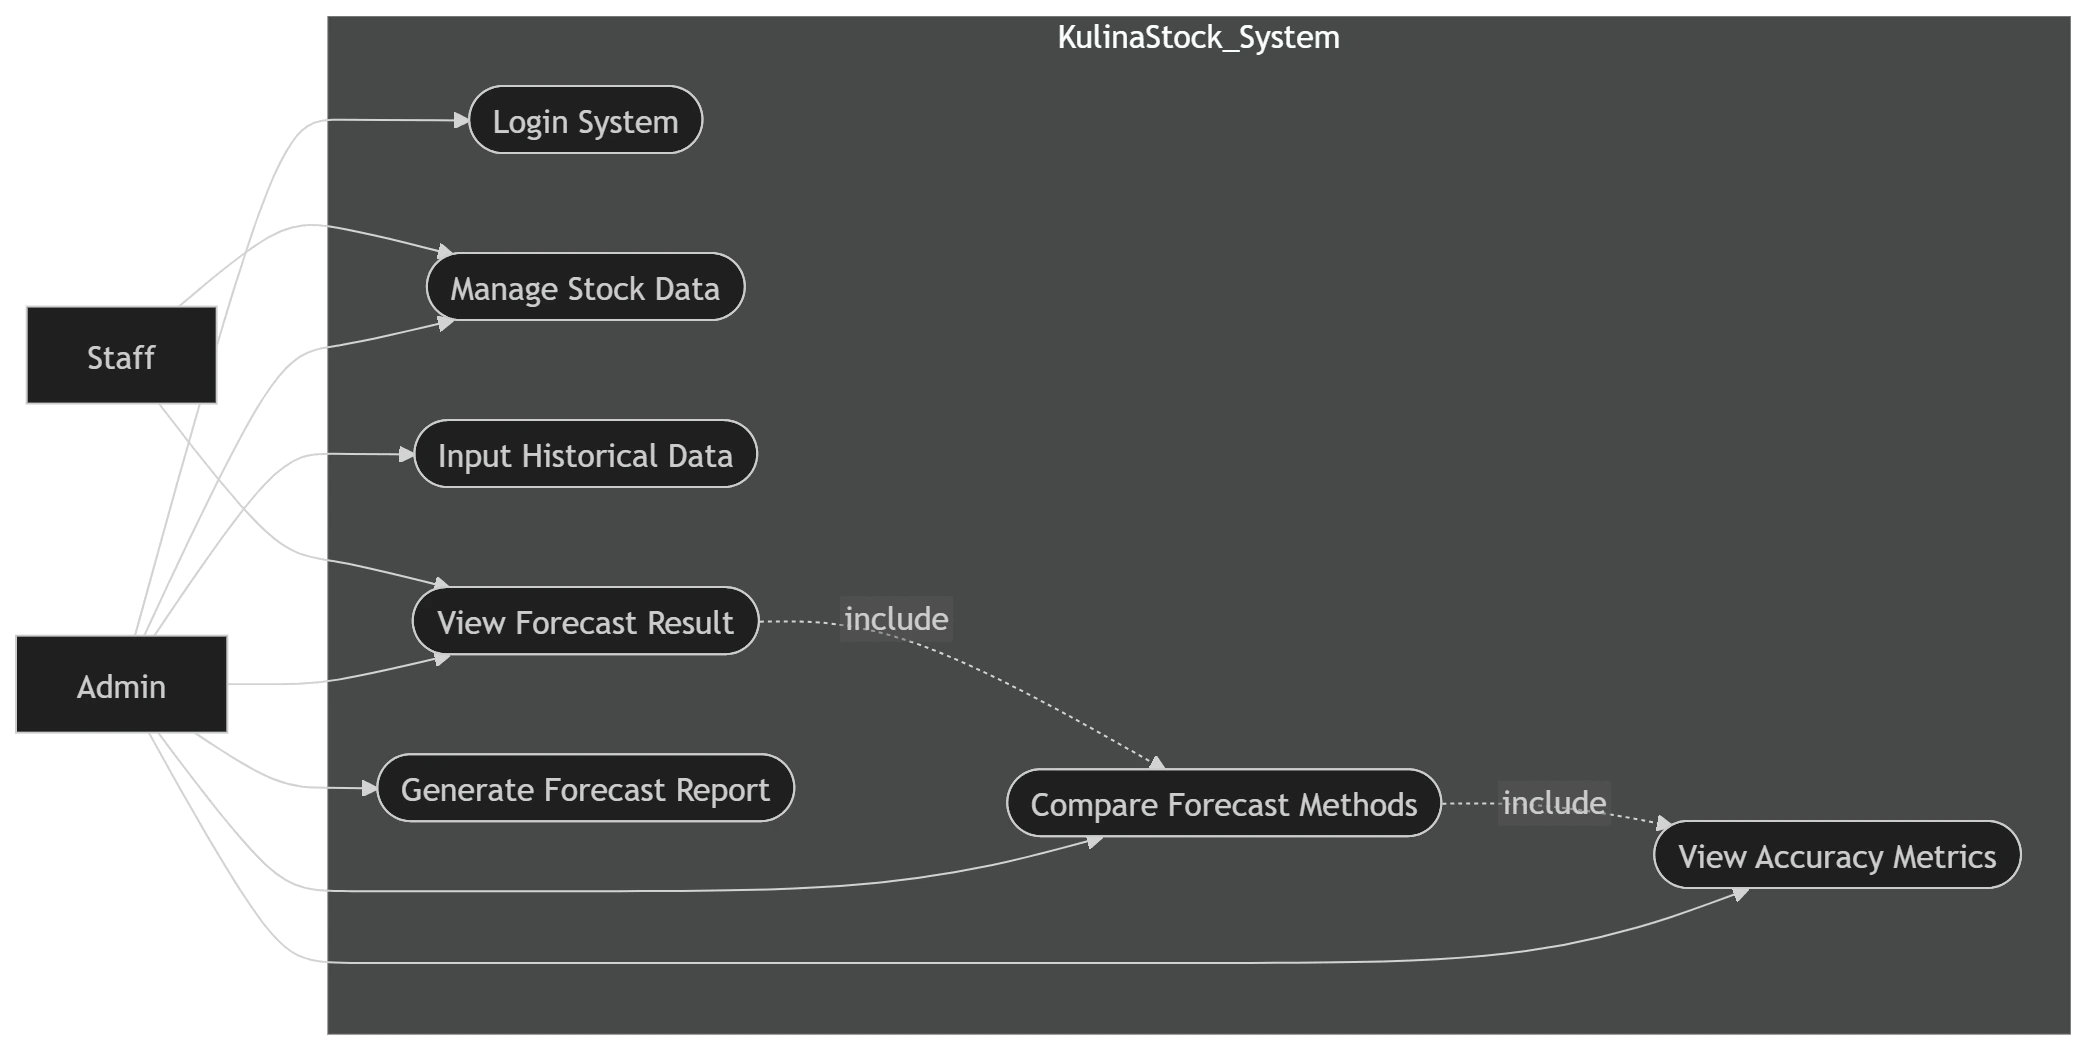
Forecasting Workflow
Users can manage inventory data, input historical stock usage, compare forecasting methods, and evaluate prediction accuracy through centralized dashboard operations.
Database Design
Entity Relationship Diagram
The relational schema is designed to manage inventory items, historical stock usage, user authentication, and forecasting results.
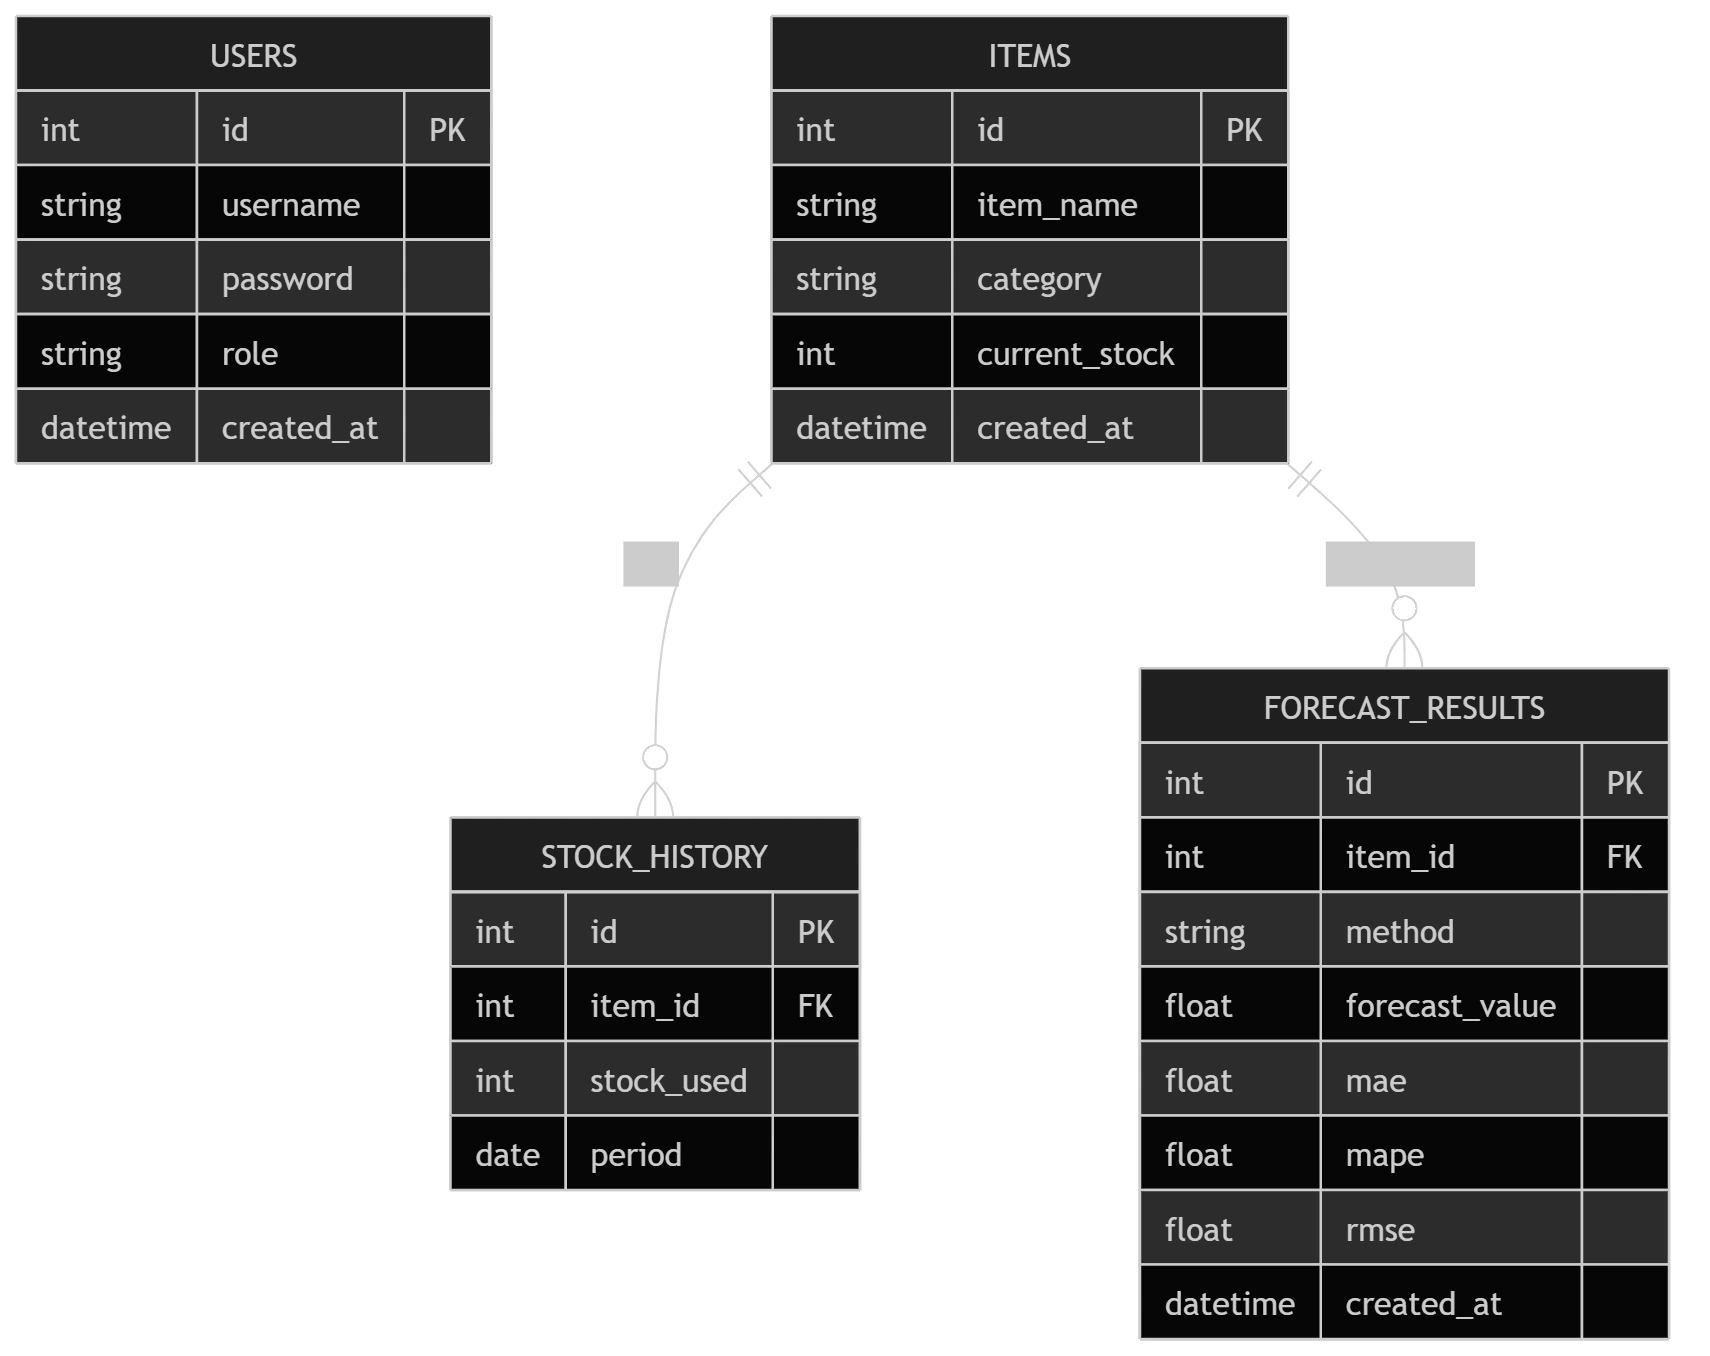
Database Considerations
- • Historical stock data is separated into dedicated relational records.
- • Forecast results are stored independently to support method comparison analysis.
- • Foreign key constraints maintain relational consistency between items and forecast records.
Forecast Persistence
Forecast outputs and accuracy metrics are persisted for historical evaluation, reporting generation, and future comparison.
Forecast Engine
Prediction Processing
Forecast calculations are executed using multiple time-series methods to evaluate prediction performance and trend behavior.
SES Forecast
Uses weighted averages from previous periods to smooth forecasting fluctuations.
Holt Forecast
Captures linear trend movement to improve medium-term predictions.
Holt-Winters
Supports seasonal forecasting behavior using trend and seasonality components.
Technical Flow
System Workflow Diagrams
The following diagrams illustrate authentication, forecasting execution flow, and inventory prediction processing.
Forecast API Sequence
This sequence diagram demonstrates how forecasting requests are processed through API routes and forecasting engines.
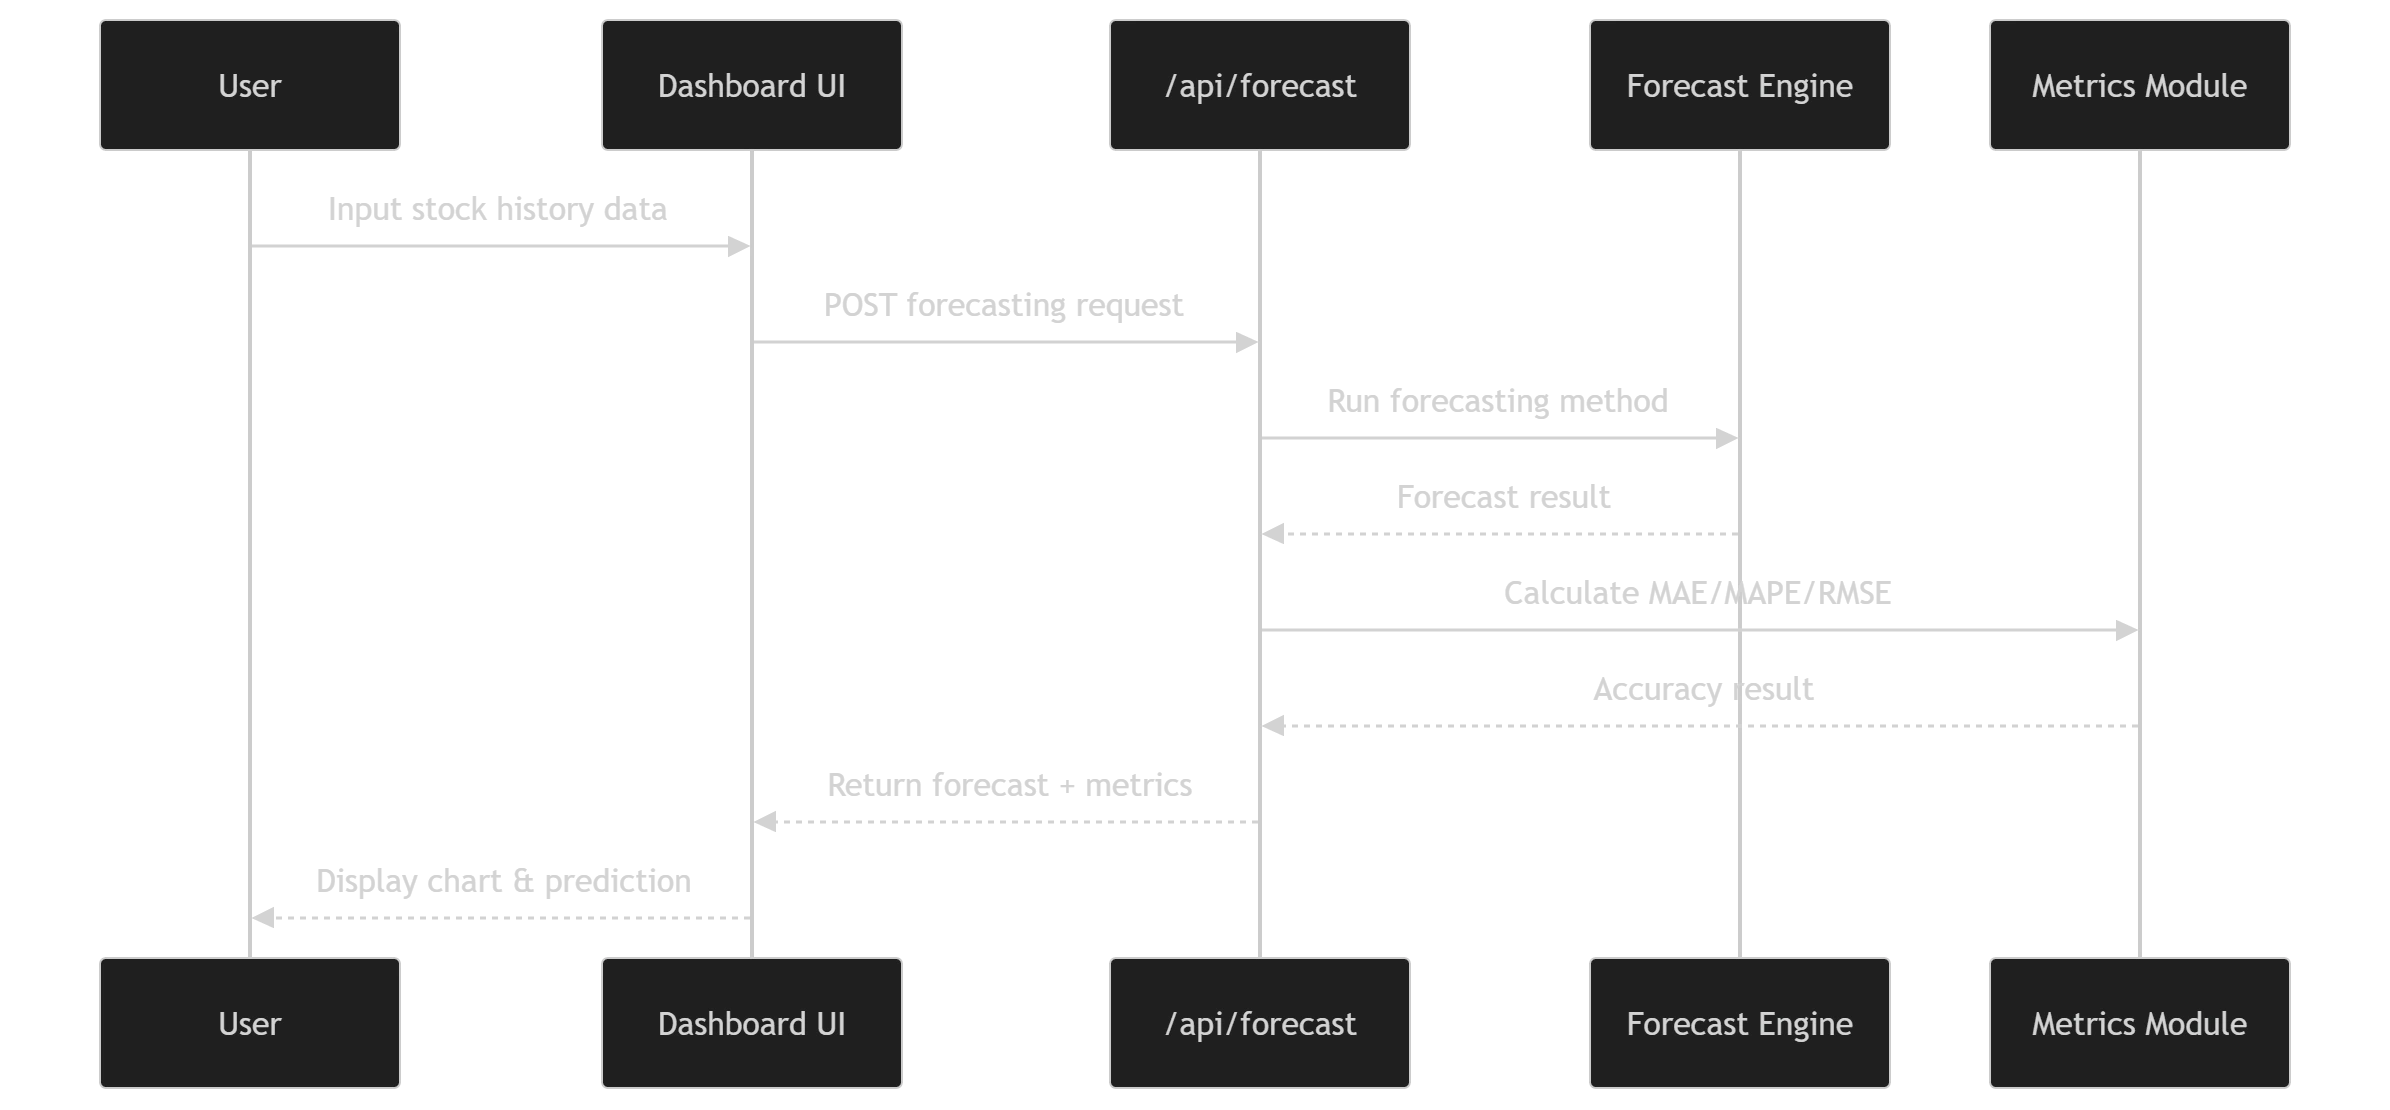
Metrics Evaluation Flow
Forecast outputs are evaluated using MAE, MAPE, and RMSE calculations before results are returned to users.
Forecasting Workflow
This activity diagram illustrates the forecasting process from authentication and data input to prediction generation.
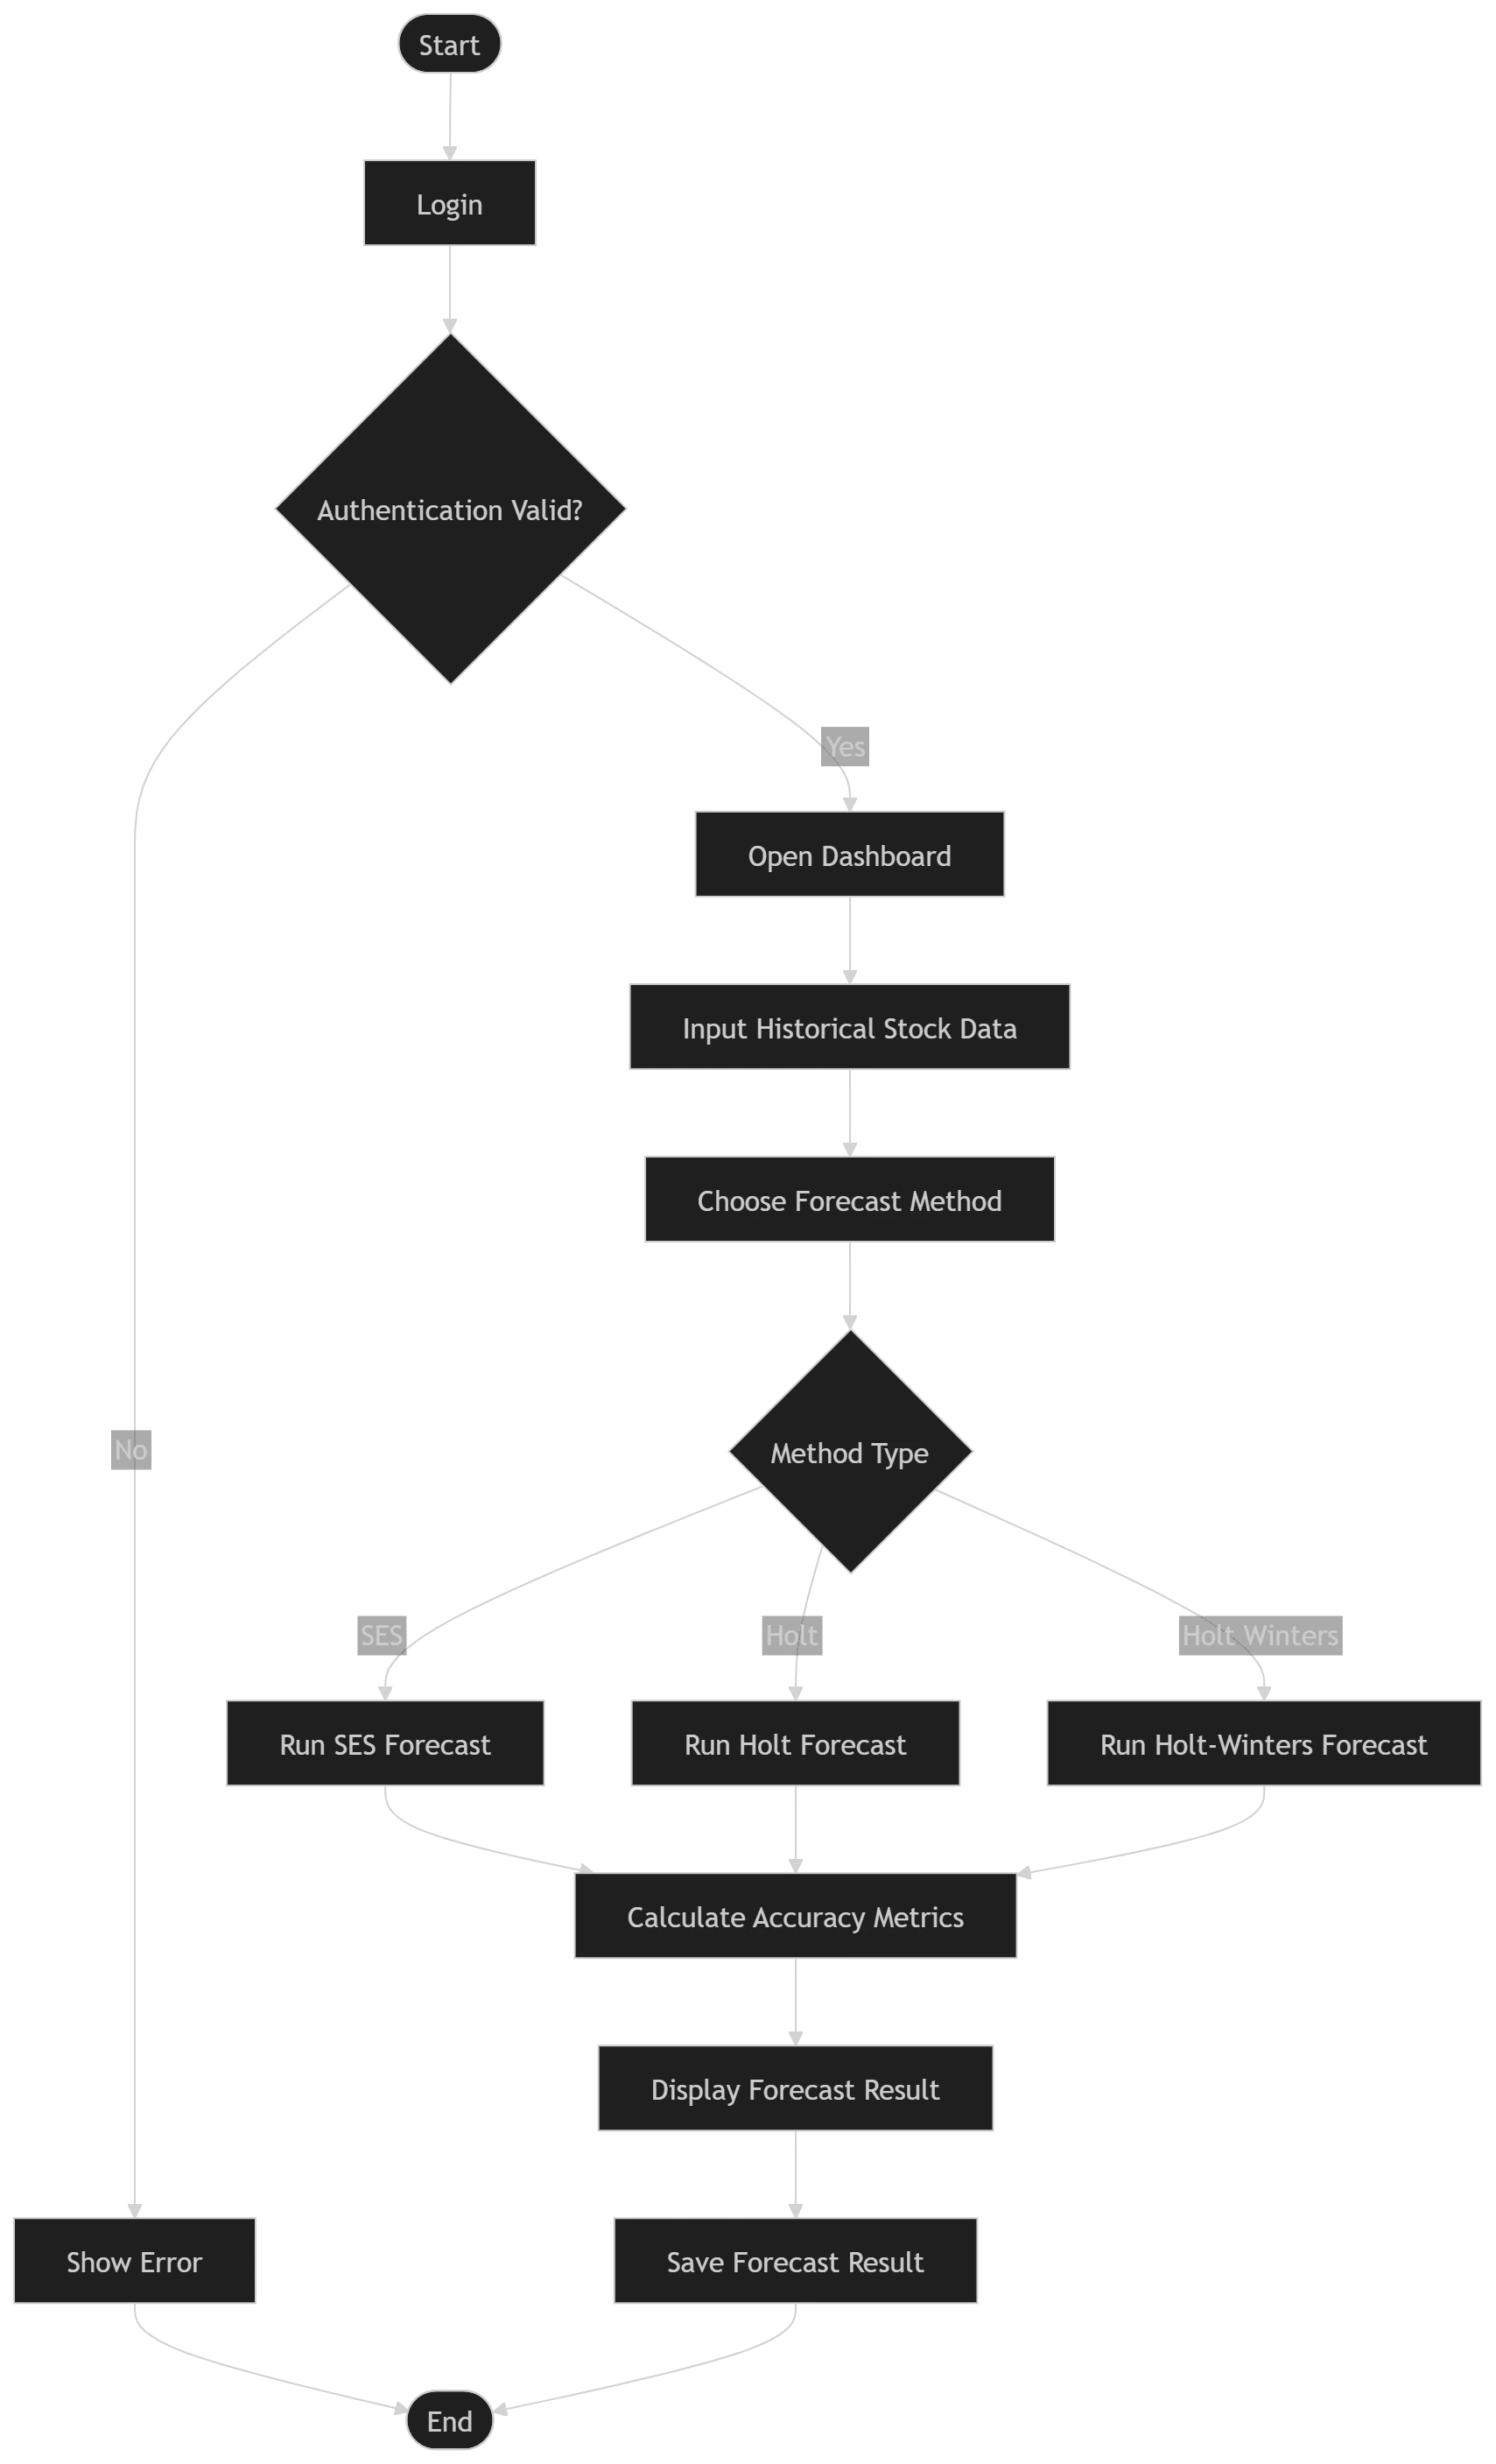
Forecast Processing Pipeline
Users authenticate into the dashboard, select forecasting methods, calculate prediction metrics, and store forecast results into the database.
Project Metrics
Technical Overview
3
Forecast Methods
MAE
Error Metric
MAPE
Error Metric
RMSE
Error Metric
Future Improvements
Scalability & Optimization
Advanced Forecast Models
Additional forecasting algorithms such as ARIMA or Prophet can improve prediction flexibility for complex datasets.
Interactive Visualization
Dynamic forecasting charts and real-time analytics dashboards can improve forecasting interpretation.
Automated Parameter Tuning
Forecast accuracy can be improved through automatic alpha, beta, and gamma optimization strategies.
Forecast History Tracking
Historical forecast comparison features can improve analytical validation and reporting workflows.